Data Science and Analytics - University of Idaho Foundation
Lead Data Scientist (Wizard)
Data Advisor
ML Consultant
Independently Ranked Long-Form Accomplishments:
V = Company Value
I = Impressiveness
1. Quantified $30K in Missed Donations Due to Vendor Failure
V: 10 | I: 7
Identified and documented a sudden 96% drop in donation volume linked to a third-party giving platform failure. Analysis showed at least 14 first-time donors lost, 55 manual reroutes required, and a $30,000 shortfall over three weeks. This gave leadership leverage in negotiating long-term cost adjustments with the vendor and raised internal awareness of first-time donor retention risks.
2. Saved $25K–$40K by Replacing Manual Endowment Review with AI
V: 9 | I: 9
Eliminated the need to hire four interns to review over 2,000 30-page endowment agreements. Used embedding similarity search and ranking algorithms to prioritize documents for targeted human review, drastically reducing hours required while preserving accuracy. This project introduced scalable, intelligent document processing to the Foundation.
3. Recovered 30% of Unmatched LinkedIn Records and Corrected Errors
V: 9 | I: 8
Created a multi-layer matching algorithm using partial names, nicknames, email, spouse info, degrees, and addresses to recover 30% of ambiguous records previously unresolved by LinkedIn's own system. Also corrected vendor mismatches, improving both personal and business entity resolution. Boosted the usefulness of contracted data and improved confidence in its integration.
4. Automated 85% of a Critical Recurring Reporting Workflow
V: 8 | I: 6
Converted a manual, biweekly 3–4 hour reporting task into a 20-minute automated process by scripting secure file downloads, aggregations, and formatting into production-ready reports. Removed human error, freed up analyst time, and created a foundation for ongoing automated operations.
5. Built First Machine Learning Models for Institutional Data
V: 7 | I: 10
Launched the Foundation’s first operational machine learning pipeline, including anomaly detection. The models surfaced real-world data issues—such as a previously unnoticed break in registrar data flow—demonstrating both technical capability and real business relevance from early in deployment.
6. Streamlined Manual Review of 1,000+ Records
V: 7 | I: 7
Transformed a labor-intensive identity matching process into a directed review pipeline. Automatically flagged likely matches for human confirmation, reducing workload while improving precision. Created a scalable review process applicable across other data sources and contract projects.
7. Improved Entity Matching for People and Businesses
V: 6 | I: 8
Engineered a robust, multi-field matching framework to reconcile ambiguous records across internal and external systems. Matched people and companies using flexible combinations of identifying fields, outperforming simpler deterministic logic and opening up new applications for data enhancement.
8. Developed Custom Imputation Algorithms for Missing Data
V: 5 | I: 7
Designed and implemented logic to impute missing fields (e.g., degree year, marital status, etc.) across historical records. Improved the completeness and integrity of donor data, feeding higher-quality input into ML models and visualizations, and enabling more reliable insights.
9. Created Excel File Format Automation for Analysts
V: 4 | I: 5
Automated the visual formatting of multi-tab Excel workbooks, including header highlights, table styles, and conditional formatting. Enabled non-technical users to receive professional-quality reports with minimal manual touch-up.
10. Advised on Strategic Data Collection Priorities
V: 4 | I: 6
Provided ongoing feedback on data fields not currently collected but critical for future modeling efforts (e.g., wealth indicators, digital engagement scores). This advisory role ensures the organization is not just reactive but preparing its data ecosystem for long-term success.
I truly enjoy being a mathematical gymnast. Creating meaningful and engaging visualizations is my passion.
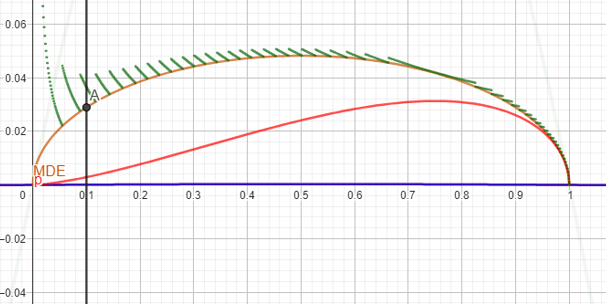
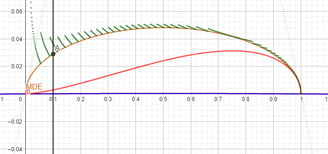
This raph shows minimal detectable effect of an AB test as a function of response rate for a given sample size.
Lower curve shows percentage of base population.
Discontinuous green curve shows whole number of values needed to reach minimal detectable effect.
Content in both autonomous and team settings, I provide any statistical process requested. I enjoy making recommendations and improvements to existing processes and procedures.
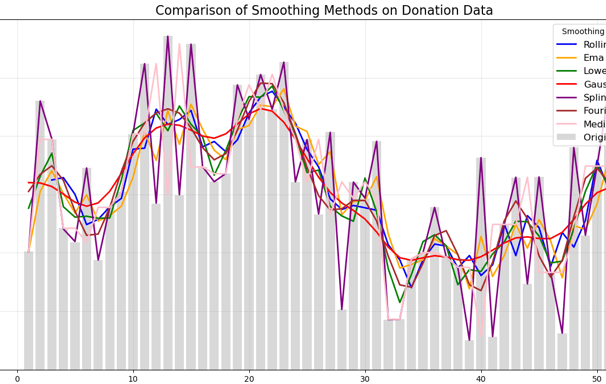
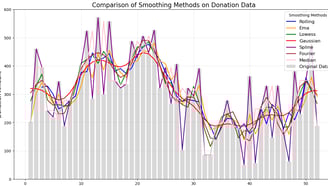
Graph shows a bar graph of raw data and a collection of different smoothing functions that could be applied over that data.
Smoothing functions include exponential mean average, rolling average, gaussian curve, Spine curve, median curve, lowest polynomial fit curve, fourier curve.
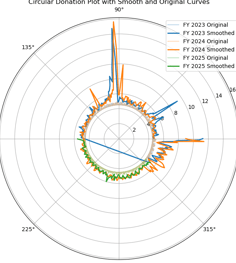
I am often asked to lead discussions, presentations, and projects for both technical and non-technical audiences. I always tailor my work to meet the needs of the viewer.
Graph shows a circle representing a calendar year and a time series of donations is wrapped around the circle for several fiscal years.